
A Couple And Some
July 11 2025 -- In a time of continuing uncertainty fostered by the haphazard implementation of new or expanded tariffs, there's plenty of speculation about when the Federal Reserve might resume cutting rates. Of course, the problem is one of absolutes; had the so-called "Liberation Day" tariffs been implemented in April, we'd already by now be developing a sense of how these would be affecting trade flows, the broader economy and inflation. A 90-day "pause" on their enactment left in place a set of blanket (and some targeted) tariffs, and the full rollout of higher levies would come July 9.
Except again, it didn't, as the kickoff date has now been bumped to August 1. Of course, this date is after the upcoming Fed meeting, where few expect to see a rate cut occur. However, if the new or expanded tariffs actually start next month, that leaves only about six weeks for any effects to begin to show and is hardly enough time to be able to get a full assessment of their impact. The move to delay the new levies again threatens to upend expectations for a September rate cut, but reading through the minutes of the June FOMC meeting, it appears that there were already growing doubts within the Fed that any cuts this year may be warranted, given a lack of clarity.

That said, the official Fed outlook suggests that one or two cuts in rates are generally expected to come this year. And, according to the minutes of the June 17-18 get-together, "A couple of participants noted that, if the data evolve in line with their expectations, they would be open to considering a reduction in the target range for the policy rate as soon as at the next [July] meeting." A couple would be two of twelve policy-voting members. However, it would seem that somewhat more aren't ready to trim policy rates anytime soon, as "Some participants saw the most likely appropriate path of monetary policy as involving no reductions in the target range for the federal funds rate this year,"
It's not clear how many folks are a "some", but we'd reckon that to be four or perhaps more, based on the last Summary of Economic Projections, where 7 of 19 forecasts pointed to no expected change in rates by the end of 2025 (not all members who provide SEP forecasts have policy votes). Currently, futures markets place only fractional odds of a cut in rates this month, while the a change at the September meeting is still reckoned to have about 2 to 1 odds that a quarter-point reduction will occur. Of course, the last Fed meeting and SEP forecasts were put together before the additional one-month bump in tariff implementation, and we still have little sense of how high the final levies will be, on whom, or what goods will be most affected, leaving aside new saber-rattling of 50% tariffs on Brazil and 35% levies on Canada (should they even come to pass).
Want to get MarketTrends as soon as it's published on Friday? Get it via email -- subscribe here!
It will be interesting to see whether "a couple" join the "some", or if the presumably six other FOMC members somewhere in the middle have changed their positions at all, but we won't actually know until the September meeting comes and the next SEP is due. It may be that a cut does come at that time, and then that's it for 2025; we'll just have wait to find out. When they do eventually start to trim rates, don't expect large cuts or even much by way of a large cumulative move unless things truly turn south. The minutes also revealed that "Several participants commented that the current target range for the federal funds rate may not be far above its neutral level."
The Fed would be more likely to consider trimming rates regardless of tariff impact if the labor market was deteriorating rapidly. While certainly not robust, job growth continues along at a modest pace, the unemployment rate remains at a level close to full employment, and widespread layoffs are low, although government payroll reductions may start to be seen more routinely as the summer progresses. Job openings recently expanded again, although actual hiring remains at a fairly tepid pace. A low level of layoffs is seen in initial claims for unemployment benefits, which have continued to diminish in recent weeks after a late-spring increase. In the most recent week (through July 5) just 227,000 new applications for benefits were filed, the fewest since mid-April. However, the ranks of those receiving benefits continues to edge higher, reflective of the difficulty of securing a new gig. Some 1.965 million folks -- 10,000 more than the prior week -- were collecting unemployment insurance in the latest week.
Find these only at HSH.com!
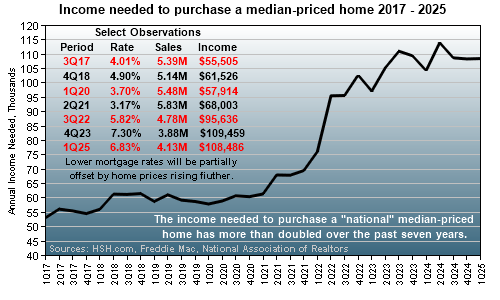
Longer-term interest rates had recently found some stability, and even a little space to decline, but this seems to be washing away along with fresh tariff uncertainty and the saber-rattling noted above. Not that mortgage rates have been all that favorable this year, but they have at least been largely rangebound, albeit at an elevated level. This continues to pressure home affordability, as home prices remain close to record high levels.
|
Inventories of existing homes for sale are as high as they have been in many years, and stocks of newly constructed homes as deep as they have been since 2007. Provided lower mortgage rates don't suddenly appear and goose demand from present tepid levels, more inventory coming on line does suggest that we may start to see some more widespread softening in home values later this year beyond typical seasonal cooling. Lower home prices will help affordability, but only at the margins, as they don't carry the same income-leveraging effect that lower mortgage rates do. Still, any improvement in affordability would be welcomed, at least by potential homebuyers, if not those discounting prices to make sales happen.
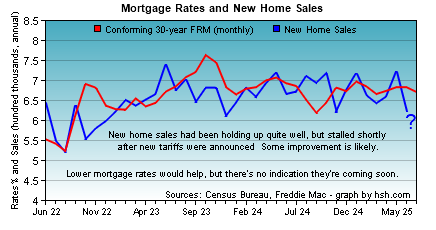
We did see a notable decline in sales of new homes in May, but wonder if it's a temporary dip from the initial tariff shock (and financial market upheaval) in April. The drop in stock values (subsequently recovered) may have blown a hole in many homebuyer downpayment plans, who may have stepped away to reassess their desire to take on a large new debt for a home while markets were roiling and the funds needed to do so far from secure.
|
If so, we'd expect to see some rebound in sales for June and perhaps July, even as builders will continue to need to provide discounts and financing supports to move inventory. At present, given that median new home prices are nearly identical to median existing home costs, such mortgage deals are perhaps a key advantage to induce borrowers to buy a newly-constructed home.
We're yet a few weeks away from the initial estimate of GDP growth for the second quarter, but all indications are that a modest level of expansion resumed during the period after a import-related stall in the first stanza of 2025. Two working models point to fair-to-middling growth; the Federal Reserve Bank of Atlanta's GDPNow model pegs GDP growth at an annualized 2.6% pace using data released up to July 9, while the FRB/New York's Nowcast points to a more modest 1.56% rate through July 11. Taken together, growth is likely somewhere in the 2% range, not too hot, not too cool, and absent tariff uncertainty, probably a level that might have seen the Fed trimming rates in just a couple of weeks' time.
See today's mortgage rates every day at HSH.com
Does mortgage history repeat? Usually. Find out what happened last week/month/year with MarketTrends archives!
New borrowing by consumers increased slightly in May, rising by $5.1 billion. Non-revolving credit -- think auto, personal and education loans -- was the cause of the increase, as these balances expanded by $8.6 billion. Revolving balances (credit cards) actually shrank by $3.5b for the month, as consumers paid down about half of the amount they amount they took on during April's modest binge. We suspect that "buy now, pay later" programs have replaced some casual credit card use as consumers look to avoid paying interest on purchases that will be likely paid off within a few months.
Inventory holdings at the nation's wholesaling firms declined by 0.3% in May. Durable goods holdings were drawn down at a 0.8% pace during that month, while non-durable inventories expanded by 0.5%. Conversely, sales of durable goods rose by 0.2% while those for nondurables dropped 0.8%. All in all, inventory levels and sales both declined by 0.3%, allowing the wholesale inventory-to-sales ratio to remain at 1.3 months of supply at the present rate of sale. As it's been at this level in five of the last six months, it's probably only low enough to allow a modest level of new orders to manufacturers until demand picks up.
Picking up a bit in the first week of July were requests for mortgage credit, continuing a pattern we noted a couple of months ago with mortgage applications tending to increase around the first week of each month. In this case, for the week ending July 5, a 9.4% increase in requests for mortgages were tallied by the Mortgage Bankers Association, building on a smaller increase to close June. Purchase-money mortgage applications rose by 9.4%; those to refinance existing loans bounced 9.2% higher. With mortgage rates firming a little again, odds favor we'll see a decline in mortgage applications next week.
Current Adjustable Rate Mortgage (ARM) Indexes
| Index | For The Week Ending | Year Ago | |
|---|---|---|---|
| Jul 04 | Jun 06 | Jul 05 | |
| 6-Mo. TCM | 4.30% | 4.30% | 5.36% |
| 1-Yr. TCM | 4.00% | 4.10% | 5.05% |
| 3-Yr. TCM | 3.76% | 3.92% | 4.50% |
| 10-Yr. TCM | 4.29% | 4.44% | 4.39% |
| Federal Cost of Funds |
3.662% | 3.663% | 3.956% |
| 30-day SOFR (daily value) | 4.32730% | 4.30620% | 5.33501% |
| Moving Treasury Average (MTA/12-MAT) |
4.221% | 4.308% | 5.163% |
| Freddie Mac 30-yr FRM |
6.67% | 6.84% | 6.89% |
| Historical ARM Index Data | |||
The economic calendar becomes considerably busier next week. Of particular interest will be the releases of June's Consumer and Producer Price indexes, where impacts from the "blanket" tariffs of the last couple of months will start to be reflected. We'll also see what's happening with import and export prices; these are tallied outside of direct tariff impacts, but may show some bleed through from overall higher costs here and abroad. The Fed's broad anecdotal review of economic conditions known as the Beige Book will also be released, imparting a sense of how business contacts across the Fed's 12 Districts are managing in the ongoing uncertain climate.
We are expecting to see somewhat higher inflation figures in the CPI and PPI data, and those have the power to further lift longer-term interest rates, which firmed up a bit this week after a couple of weeks of modest declines. Based upon how the yields which most influence fixed-rate mortgages behaved this week, we think average rates for conforming 30-year fixed rate mortgages as reported by Freddie Mac will rise by a couple of basis points and then some, with an upward move of 5-8 basis points most likely.
Spring has given way to the lazy days of summer, but what's the outlook for mortgage rates between now and September? Check out our latest Two-Month Forecast for mortgage rates covering July and August.
See our 2025 Mortgage and Housing Market Outlook, covering mortgage rates, housing conditions, the Fed and lots more. Our mid-year review of our expectations is coming next week.
Also, for a really long-run outlook, you'll want to review "Federal Reserve Policy and Mortgage Rate Cycles".
Have you seen HSH in the news lately?
Want to comment on this Market Trends? -- send your feedback, argue with us, or just tell us what you think.
See what's happening at HSH.com -- get the latest news, advice and more! Follow us on Twitter/X.
For further Information, inquiries, or comment: Keith T. Gumbinger, Vice President
Copyright 2025, HSH® Associates, Financial Publishers. All rights reserved.