One Scenario for Interest-Only Mortgages
These charts accompany "The Principal Facts of Interest-Only Mortgages".
In order to see if, or how well, a Constant Level Payment strategy might work, we needed to base our calculations on real information, since any monthly ARM will see its interest rate change each month. Usually, these products will have a low fixed interest rate for the first three months; after that, they will float along with the total (the sum) of the value of the index plus the value of the margin (Index + Margin = New Rate). Normally, monthly ARMs have no caps on how much the rate might change from month to month or even year to year, but usually have an upper limit (a lifetime cap or ceiling) on how high the rate might rise. For many product, that's the initial fully-indexed (the first non-introductory rate) rate plus six percentage points.
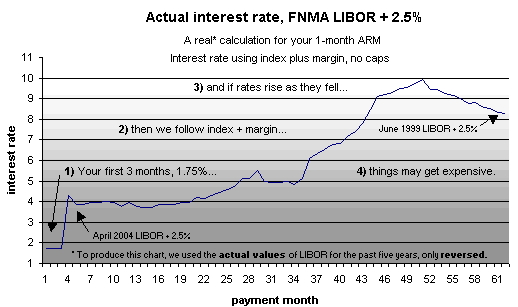
Our real information here is the actual value of FNMA LIBOR over the past 5 years. However, as rates fell appreciably over that time, we thought it proper to simply retrace the steps back up to a level seen recently; just as rates trended down along with a deteriorating economy, it's not unreasonable to forecast that, in an improving economy, we might see interest rates trend back upward over the next few years. To the index value, we added 2.5% (250 basis points) which is a common margin found on these loan products.
All the charts which follow utilize a $100,000 initial loan amount. For a $200,000 loan, simply double the payment and total interest figures.
Chart 2: Required interest-only payment
As interest rates rise (and hopefully fall) your required interest only payment will rise and fall along with each change in interest rates. If interest rates should re-trace their path of the past five years, you might find that even your interest-only payment becomes uncomfortable, with a doubling of your required monthly payment over the period shown.
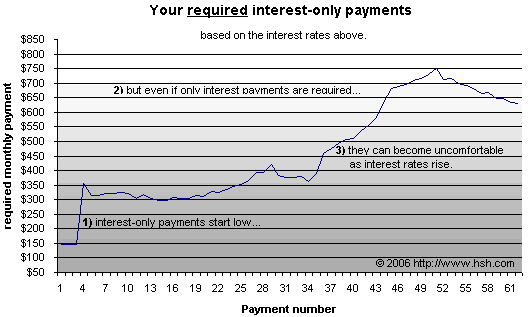
Chart 3: Required and actual payment versus prepayment level
This is the most complicated chart of the series.
Our premise for this example is that you are making a Constant Level Payment; that is, you could have selected a fixed-rate mortgage at 6%, but instead opted for a monthly ARM (with an initial interest rate of 1.75%) -- but will make payments each month as though it had a 6% interest rate. In this example, that dollar amount is $599.55 per month, represented by the blue line.
Initially, and for the first 39 months, you will be making a sizable principal repayment of your loan (the green line). However, as interest rates rise, your prepayment rate will slow, because more and more of your $599.55 is committed to the required interest payment (the purplish line), leaving less and less to repay principal. While the required (I/O) payment doesn't intersect your preferred payment until month 44, you have actually stopped prepaying the loan at month 39; that is, the payment you are sending at that point is no longer sufficient to amortize the loan over 30 years, let alone prepay it.
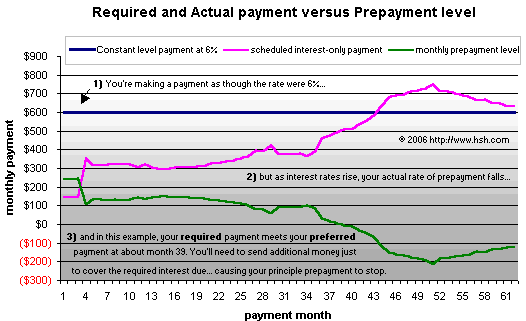
(Note: we could have stopped the chart's green line at month 39, the point where amortization comes to a halt. However, it is instructive to see what may have occurred should you make only a 'minimum payment' not even sufficient to cover the interest which is due. In such cases, the amount due in excess of what you paid is added back onto the loan's balance, a process known as "negative amortization". Please be aware that some ARMs allow for this... and we hope to have some charts and discussions of this soon).
Chart 4: Remaining balance comparisons
As you can see, prepaying your low-interest rate ARM at a higher interest rate has certainly reduced the remaining balance, but because interest rates have risen, you have stopped amortizing the ARM at all in month 39, allowing the fixed rate to close the remaining balance gap. Despite the rise in rates, at the end of the five-year period, you will still have a smaller loan balance for the ARM when compared against a fixed rate.
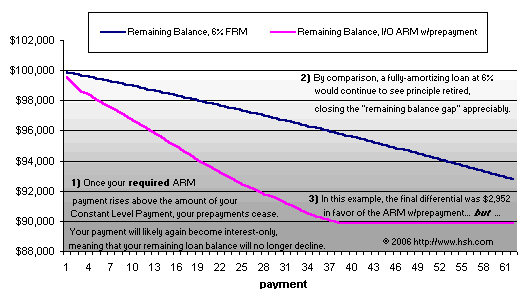
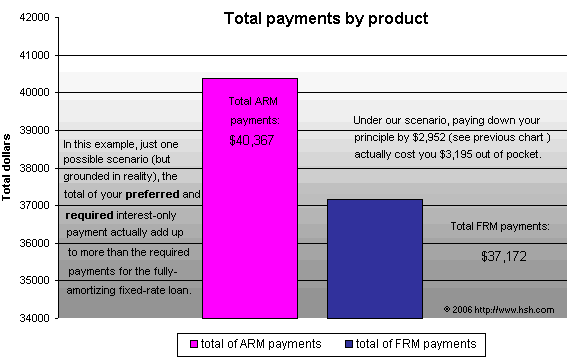
Chart 5: Total payments by product
Because interest rates (in this scenario) have risen over the five-year period, your monthly payments for the ARM have climbed above the $599.55 you would have preferred to send. In fact, the total of your required and preferred payments for the ARM will see you pay over $40,367 for the period, while the standard 6% FRM will have only a total of $37,172. As a result, while your remaining balance for the ARM is measurably smaller than for the FRM, it hasn't happened without any cost to you.
It's important to note that while the underlying scenarios used in these examples are grounded in reality, there's no way for us (or anyone) to accurately predict what will happen to interest rates in the coming years. Even though rates are likely to rise, they may not rise enough even reach the intersections described above, and you may continue to enjoy a lower interest rate, a stable monthly payment and a more-quickly declining loan balance over the period... or not.
Copyright © 2006, HSH Associates.


